



BizPeel · Business report · Image-ChartsReport v1 · data as of 2026-10-30
Image-Chartswww.image-charts.com

How did a one-founder chart API earn $542k in ten years, and why is it slipping now?
www.image-charts.comwww.image-charts.com
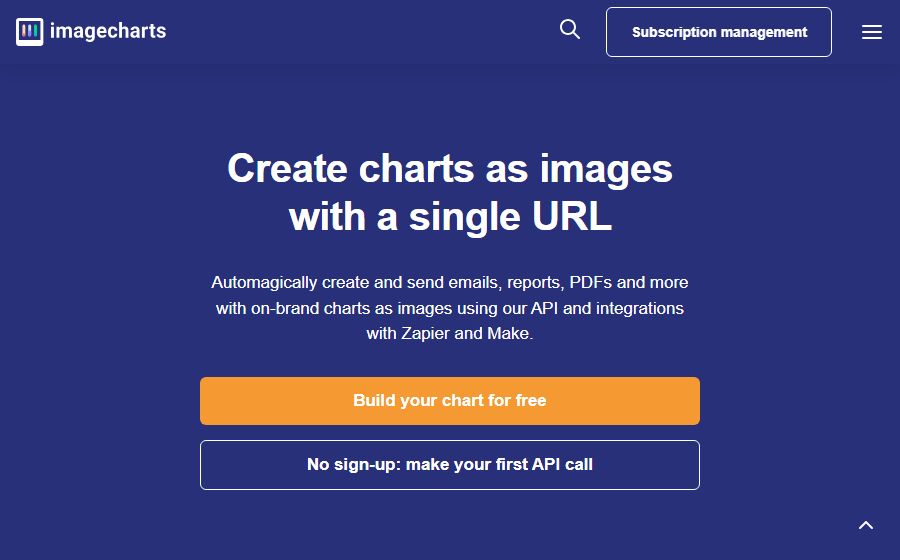
- What it is
- an Unclassified product.
- Who buys
- Buyer profile not disclosed.
- Pricing
- The public pricing page lists 2 tiers: $99/mo, $249/mo.
- Model
- Subscription. MRR covers 96.2% of 30-day revenue.
- 近 30 天收入
- US$6.5K
- MRR
- US$6.3K
- 活跃订阅
- —
- 累计收入
- US$78.2K
已验证
月度经常性收入
未披露
已验证
Revenue as of 2026-10-30(public sources, updated daily)01
Summary
What kind of business is this
Visit site www.image-charts.comImage-Charts is a Unclassified business. The public pricing page lists 2 tiers: $99/mo, $249/mo. Revenue is almost entirely renewals: MRR covers 96.2% of the last 30 days.
- Form
- Unclassified
- Pricing
- Subscription
- Entry price
- $99/mo
- Launched
- 2017-01
www.image-charts.com
Core growth findings
01
$6.5K in 30 days, and growth has flattened
12 mo $78.2K, $6.5K in the last 30 days.
02
Renewals carry the business — MRR is the base
$6.3K of MRR, $6.5K in 30 days.
03
No public channel — word of mouth and search do the work
4 social profiles linked.
Number tagsFactStraight from the sourceDerivedCalculated from factsClaimedSelf-reported, unverifiedEstimateOur reading
Subscribe to read the full report
All 6 chapters, with every data point, post and source.
- ?How did a one-founder chart API earn $542k in ten years, and why is it slipping now?
- ?Where do its visits mainly come from?
- ?How does the free version sell the paid one?
- 01Product overview
- 02Marketing landscape
- 03Growth playbook
- 04How they use social
- 05Timeline
- 06Advice for you
Subscribe to read the full study
5 more chapters hidden · Subscribe to read every report